Trigger a full-script rerun from inside a fragment
Streamlit lets you turn functions into fragments, which can rerun independently from the full script. When a user interacts with a widget inside a fragment, only the fragment reruns. Sometimes, you may want to trigger a full-script rerun from inside a fragment. To do this, call st.rerun inside the fragment.
Applied concepts
- Use a fragment to rerun part or all of your app, depending on user input.
Prerequisites
-
This tutorial requires the following version of Streamlit:
Textstreamlit>=1.37.0 -
You should have a clean working directory called
your-repository. -
You should have a basic understanding of fragments and
st.rerun.
Summary
In this example, you'll build an app to display sales data. The app has two sets of elements that depend on a date selection. One set of elements displays information for the selected day. The other set of elements displays information for the associated month. If the user changes days within a month, Streamlit only needs to update the first set of elements. If the user selects a day in a different month, Streamlit needs to update all the elements.
You'll collect the day-specific elements into a fragment to avoid rerunning the full app when a user changes days within the same month. If you want to jump ahead to the fragment function definition, see Build a function to show daily sales data.
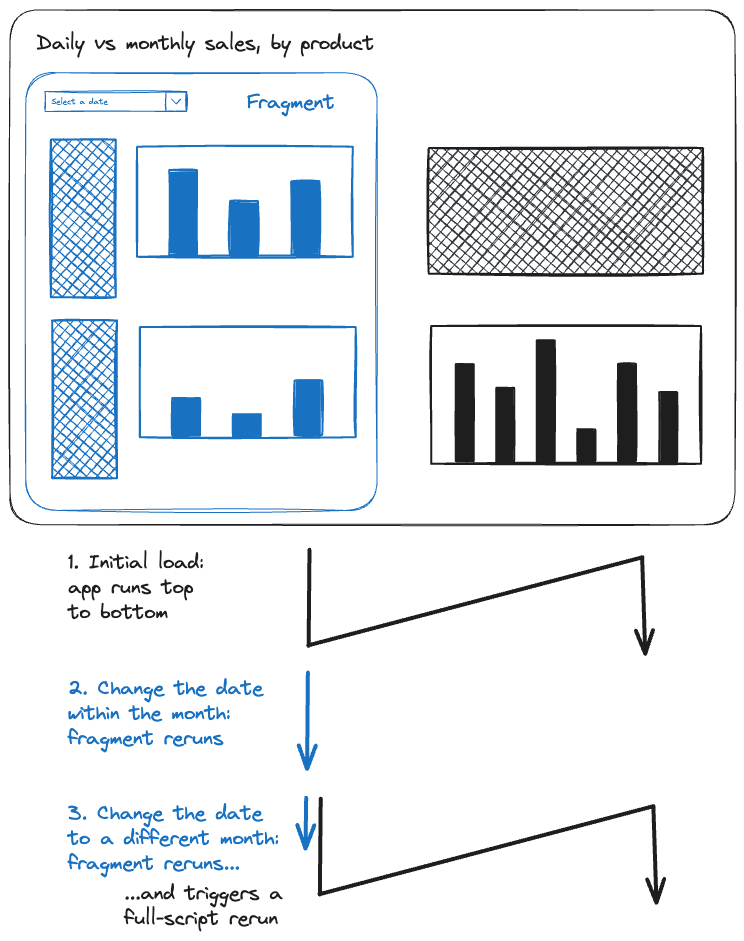
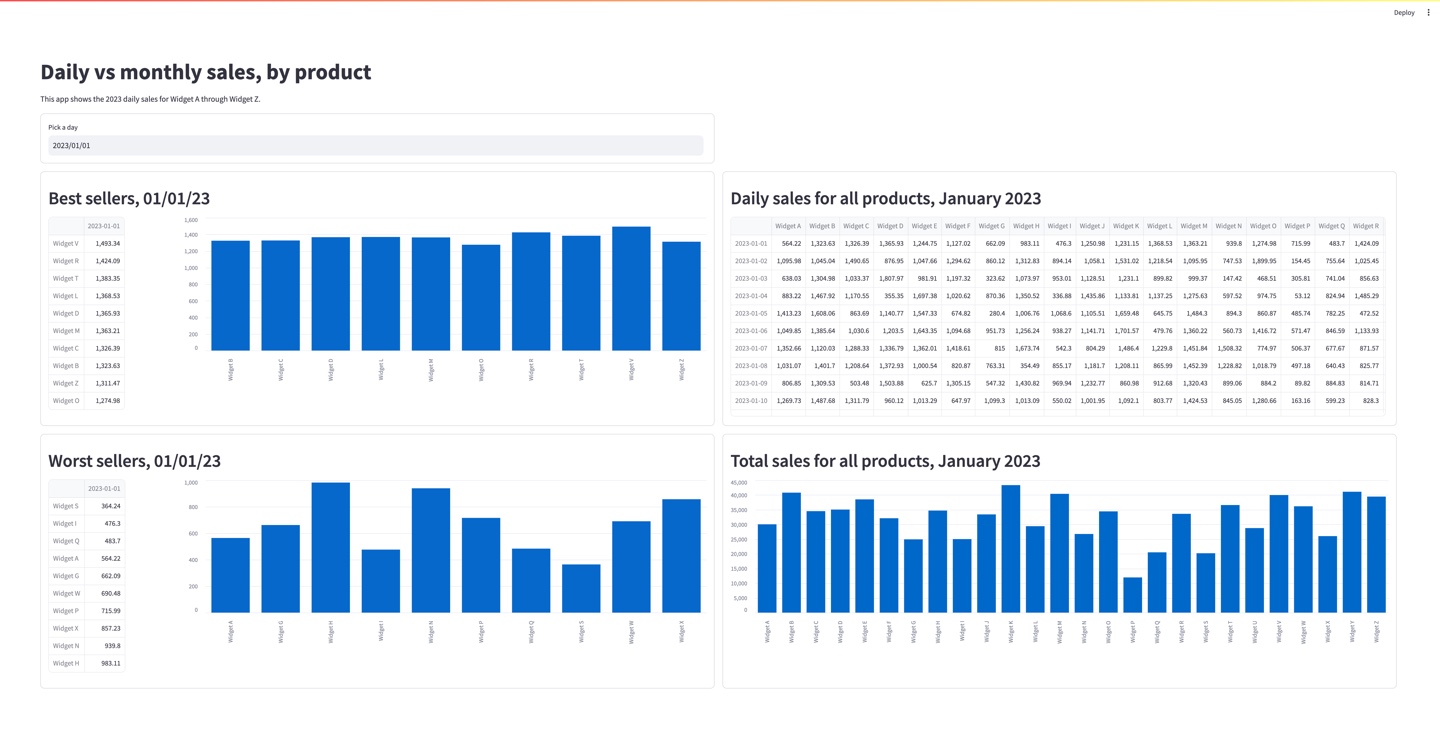
Here's a look at what you'll build:
import streamlit as st
import pandas as pd
import numpy as np
from datetime import date, timedelta
import string
import time


@st.cache_data
def get_data():
    """Generate random sales data for Widget A through Widget Z"""

    product_names = ["Widget " + letter for letter in string.ascii_uppercase]
    average_daily_sales = np.random.normal(1_000, 300, len(product_names))
    products = dict(zip(product_names, average_daily_sales))

    data = pd.DataFrame({})
    sales_dates = np.arange(date(2023, 1, 1), date(2024, 1, 1), timedelta(days=1))
    for product, sales in products.items():
        data[product] = np.random.normal(sales, 300, len(sales_dates)).round(2)
    data.index = sales_dates
    data.index = data.index.date
    return data


@st.fragment
def show_daily_sales(data):
    time.sleep(1)
    with st.container(height=100):
        selected_date = st.date_input(
            "Pick a day ",
            value=date(2023, 1, 1),
            min_value=date(2023, 1, 1),
            max_value=date(2023, 12, 31),
            key="selected_date",
        )

    if "previous_date" not in st.session_state:
        st.session_state.previous_date = selected_date
    previous_date = st.session_state.previous_date
    st.session_state.previous_date = selected_date
    is_new_month = selected_date.replace(day=1) != previous_date.replace(day=1)
    if is_new_month:
        st.rerun()

    with st.container(height=510):
        st.header(f"Best sellers, {selected_date:%m/%d/%y}")
        top_ten = data.loc[selected_date].sort_values(ascending=False)[0:10]
        cols = st.columns([1, 4])
        cols[0].dataframe(top_ten)
        cols[1].bar_chart(top_ten)

    with st.container(height=510):
        st.header(f"Worst sellers, {selected_date:%m/%d/%y}")
        bottom_ten = data.loc[selected_date].sort_values()[0:10]
        cols = st.columns([1, 4])
        cols[0].dataframe(bottom_ten)
        cols[1].bar_chart(bottom_ten)


def show_monthly_sales(data):
    time.sleep(1)
    selected_date = st.session_state.selected_date
    this_month = selected_date.replace(day=1)
    next_month = (selected_date.replace(day=28) + timedelta(days=4)).replace(day=1)

    st.container(height=100, border=False)
    with st.container(height=510):
        st.header(f"Daily sales for all products, {this_month:%B %Y}")
        monthly_sales = data[(data.index < next_month) & (data.index >= this_month)]
        st.write(monthly_sales)
    with st.container(height=510):
        st.header(f"Total sales for all products, {this_month:%B %Y}")
        st.bar_chart(monthly_sales.sum())


st.set_page_config(layout="wide")

st.title("Daily vs monthly sales, by product")
st.markdown("This app shows the 2023 daily sales for Widget A through Widget Z.")

data = get_data()
daily, monthly = st.columns(2)
with daily:
    show_daily_sales(data)
with monthly:
    show_monthly_sales(data)
Click here to see the example live on Community Cloud.
Build the example
Initialize your app
-
In
your_repository, create a file namedapp.py. -
In a terminal, change directories to
your_repository, and start your app:Terminalstreamlit run app.pyYour app will be blank because you still need to add code.
-
In
app.py, write the following:Pythonimport streamlit as st import pandas as pd import numpy as np from datetime import date, timedelta import string import timeYou'll be using these libraries as follows:
- You'll work with sales data in a
pandas.DataFrame. - You'll generate random sales numbers with
numpy. - The data will have
datetime.dateindex values. - The products sold will be "Widget A" through "Widget Z," so you'll use
stringfor easy access to an alphabetical string. - Optional: To help add emphasis at the end, you'll use
time.sleep()to slow things down and see the fragment working.
- You'll work with sales data in a
-
Save your
app.pyfile, and view your running app. -
In your app, select "Always rerun", or press the "A" key.
Your preview will be blank but will automatically update as you save changes to
app.py. -
Return to your code.
Build a function to create random sales data
To begin with, you'll define a function to randomly generate some sales data. It's okay to skip this section if you just want to copy the function.
@st.cache_data
def get_data():
    """Generate random sales data for Widget A through Widget Z"""

    product_names = ["Widget " + letter for letter in string.ascii_uppercase]
    average_daily_sales = np.random.normal(1_000, 300, len(product_names))
    products = dict(zip(product_names, average_daily_sales))

    data = pd.DataFrame({})
    sales_dates = np.arange(date(2023, 1, 1), date(2024, 1, 1), timedelta(days=1))
    for product, sales in products.items():
        data[product] = np.random.normal(sales, 300, len(sales_dates)).round(2)
    data.index = sales_dates
    data.index = data.index.date
    return data
-
Use an
@st.cache_datadecorator and start your function definition.Python@st.cache_data def get_data(): """Generate random sales data for Widget A through Widget Z"""You don't need to keep re-randomizing the data, so the caching decorator will randomly generate the data once and save it in Streamlit's cache. As your app reruns, it will use the cached value instead of recomputing new data.
-
Define the list of product names and assign an average daily sales value to each.
Pythonproduct_names = ["Widget " + letter for letter in string.ascii_uppercase] average_daily_sales = np.random.normal(1_000, 300, len(product_names)) products = dict(zip(product_names, average_daily_sales)) -
For each product, use its average daily sales to randomly generate daily sales values for an entire year.
Pythondata = pd.DataFrame({}) sales_dates = np.arange(date(2023, 1, 1), date(2024, 1, 1), timedelta(days=1)) for product, sales in products.items(): data[product] = np.random.normal(sales, 300, len(sales_dates)).round(2) data.index = sales_dates data.index = data.index.dateIn the last line,
data.index.datestrips away the timestamp, so the index will show clean dates. -
Return the random sales data.
Pythonreturn data -
Optional: Test out your function by calling it and displaying the data.
Pythondata = get_data() dataSave your
app.pyfile to see the preview. Delete these two lines or keep them at the end of your app to be updated as you continue.
Build a function to show daily sales data
Since the daily sales data updates with every new date selection, you'll turn this function into a fragment. As a fragment, it can rerun independently from the rest of your app. You'll include an st.date_input widget inside this fragment and watch for a date selection that changes the month. When the fragment detects a change in the selected month, it will trigger a full app rerun so everything can update.
@st.fragment
def show_daily_sales(data):
    time.sleep(1)
    selected_date = st.date_input(
        "Pick a day ",
        value=date(2023, 1, 1),
        min_value=date(2023, 1, 1),
        max_value=date(2023, 12, 31),
        key="selected_date",
    )

    if "previous_date" not in st.session_state:
        st.session_state.previous_date = selected_date
    previous_date = st.session_state.previous_date
    st.session_state.previous_date = selected_date
    is_new_month = selected_date.replace(day=1) != previous_date.replace(day=1)
    if is_new_month:
        st.rerun()

    st.header(f"Best sellers, {selected_date:%m/%d/%y}")
    top_ten = data.loc[selected_date].sort_values(ascending=False)[0:10]
    cols = st.columns([1, 4])
    cols[0].dataframe(top_ten)
    cols[1].bar_chart(top_ten)

    st.header(f"Worst sellers, {selected_date:%m/%d/%y}")
    bottom_ten = data.loc[selected_date].sort_values()[0:10]
    cols = st.columns([1, 4])
    cols[0].dataframe(bottom_ten)
    cols[1].bar_chart(bottom_ten)
-
Use an
@st.fragmentdecorator and start your function definition.Python@st.fragment def show_daily_sales(data):Since your data will not change during a fragment rerun, you can pass the data into the fragment as an argument.
-
Optional: Add
time.sleep(1)to slow down the function and show off how the fragment works.Pythontime.sleep(1) -
Add an
st.date_inputwidget.Pythonselected_date = st.date_input( "Pick a day ", value=date(2023, 1, 1), min_value=date(2023, 1, 1), max_value=date(2023, 12, 31), key="selected_date", )Your random data is for 2023, so set the minimun and maximum dates to match. Use a key for the widget because elements outside the fragment will need this date value. When working with a fragment, it's best to use Session State to pass information in and out of the fragment.
-
Initialize
"previous_date"in Session State to compare each date selection.Pythonif "previous_date" not in st.session_state: st.session_state.previous_date = selected_date -
Save the previous date selection into a new variable and update
"previous_date"in Session State.Pythonprevious_date = st.session_state.previous_date st.session_state.previous_date = selected_date -
Call
st.rerun()if the month changed.Pythonis_new_month = selected_date.replace(day=1) != previous_date.replace(day=1) if is_new_month: st.rerun() -
Show the best sellers from the selected date.
Pythonst.header(f"Best sellers, {selected_date:%m/%d/%y}") top_ten = data.loc[selected_date].sort_values(ascending=False)[0:10] cols = st.columns([1, 4]) cols[0].dataframe(top_ten) cols[1].bar_chart(top_ten) -
Show the worst sellers from the selected date.
Pythonst.header(f"Worst sellers, {selected_date:%m/%d/%y}") bottom_ten = data.loc[selected_date].sort_values()[0:10] cols = st.columns([1, 4]) cols[0].dataframe(bottom_ten) cols[1].bar_chart(bottom_ten) -
Optional: Test out your function by calling it and displaying the data.
Pythondata = get_data() show_daily_sales(data)Save your
app.pyfile to see the preview. Delete these two lines or keep them at the end of your app to be updated as you continue.
Build a function to show monthly sales data
Finally, let's build a function to display monthly sales data. It will be similar to your show_daily_sales function but doesn't need to be fragment. You only need to rerun this function when the whole app is rerunning.
def show_monthly_sales(data):
    time.sleep(1)
    selected_date = st.session_state.selected_date
    this_month = selected_date.replace(day=1)
    next_month = (selected_date.replace(day=28) + timedelta(days=4)).replace(day=1)

    st.header(f"Daily sales for all products, {this_month:%B %Y}")
    monthly_sales = data[(data.index < next_month) & (data.index >= this_month)]
    st.write(monthly_sales)

    st.header(f"Total sales for all products, {this_month:%B %Y}")
    st.bar_chart(monthly_sales.sum())
-
Start your function definition.
Pythondef show_monthly_sales(data): -
Optional: Add
time.sleep(1)to slow down the function and show off how the fragment works.Pythontime.sleep(1) -
Get the selected date from Session State and compute the first days of this and next month.
Pythonselected_date = st.session_state.selected_date this_month = selected_date.replace(day=1) next_month = (selected_date.replace(day=28) + timedelta(days=4)).replace(day=1) -
Show the daily sales values for all products within the selected month.
Pythonst.header(f"Daily sales for all products, {this_month:%B %Y}") monthly_sales = data[(data.index < next_month) & (data.index >= this_month)] st.write(monthly_sales) -
Show the total sales of each product within the selected month.
Pythonst.header(f"Total sales for all products, {this_month:%B %Y}") st.bar_chart(monthly_sales.sum()) -
Optional: Test out your function by calling it and displaying the data.
Pythondata = get_data() show_daily_sales(data) show_monthly_sales(data)Save your
app.pyfile to see the preview. Delete these three lines when finished.
Put the functions together together to create an app
Let's show these elements side-by-side. You'll display the daily data on the left and the monthly data on the right.
-
If you added optional lines at the end of your code to test your functions, clear them out now.
-
Give your app a wide layout.
Pythonst.set_page_config(layout="wide") -
Get your data.
Pythondata = get_data() -
Add a title and description for your app.
Pythonst.title("Daily vs monthly sales, by product") st.markdown("This app shows the 2023 daily sales for Widget A through Widget Z.") -
Create columns and call the functions to display data.
Pythondaily, monthly = st.columns(2) with daily: show_daily_sales(data) with monthly: show_monthly_sales(data)
Make it pretty
Now, you have a functioning app that uses a fragment to prevent unnecessarily redrawing the monthly data. However, things aren't aligned on the page, so you can insert a few containers to make it pretty. Add three containers into each of the display functions.
-
Add three containers to fix the height of elements in the
show_daily_salesfunction.Python@st.fragment def show_daily_sales(data): time.sleep(1) with st.container(height=100): ### ADD CONTAINER ### selected_date = st.date_input( "Pick a day ", value=date(2023, 1, 1), min_value=date(2023, 1, 1), max_value=date(2023, 12, 31), key="selected_date", ) if "previous_date" not in st.session_state: st.session_state.previous_date = selected_date previous_date = st.session_state.previous_date st.session_state.previous_date = selected_date is_new_month = selected_date.replace(day=1) != previous_date.replace(day=1) if is_new_month: st.rerun() with st.container(height=510): ### ADD CONTAINER ### st.header(f"Best sellers, {selected_date:%m/%d/%y}") top_ten = data.loc[selected_date].sort_values(ascending=False)[0:10] cols = st.columns([1, 4]) cols[0].dataframe(top_ten) cols[1].bar_chart(top_ten) with st.container(height=510): ### ADD CONTAINER ### st.header(f"Worst sellers, {selected_date:%m/%d/%y}") bottom_ten = data.loc[selected_date].sort_values()[0:10] cols = st.columns([1, 4]) cols[0].dataframe(bottom_ten) cols[1].bar_chart(bottom_ten) -
Add three containers to fix the height of elements in the
show_monthly_salesfunction.Pythondef show_monthly_sales(data): time.sleep(1) selected_date = st.session_state.selected_date this_month = selected_date.replace(day=1) next_month = (selected_date.replace(day=28) + timedelta(days=4)).replace(day=1) st.container(height=100, border=False) ### ADD CONTAINER ### with st.container(height=510): ### ADD CONTAINER ### st.header(f"Daily sales for all products, {this_month:%B %Y}") monthly_sales = data[(data.index < next_month) & (data.index >= this_month)] st.write(monthly_sales) with st.container(height=510): ### ADD CONTAINER ### st.header(f"Total sales for all products, {this_month:%B %Y}") st.bar_chart(monthly_sales.sum())The first container creates space to coordinate with the input widget in the
show_daily_salesfunction.
Next steps
Continue beautifying the example. Try using st.plotly_chart or st.altair_chart to add labels to your charts and adjust their height.
Still have questions?
Our forums are full of helpful information and Streamlit experts.