Streamlit supports several different charting libraries, and our goal is to
continually add support for more. Right now, the most basic library in our
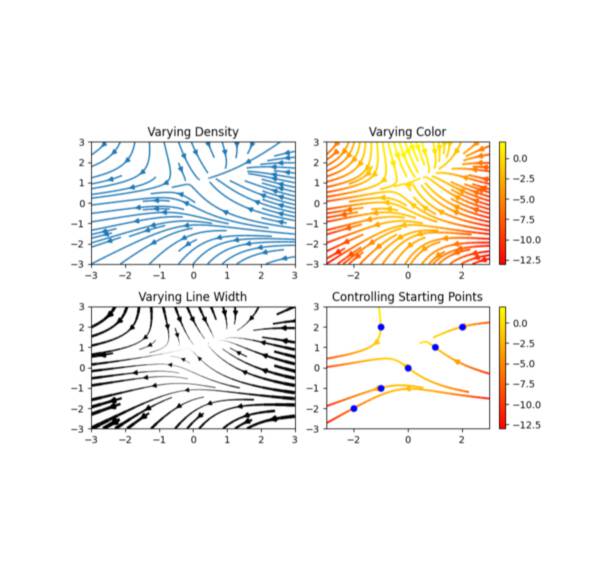
arsenal is Matplotlib . Then there are also
interactive charting libraries like Vega
Lite (2D charts) and
deck.gl (maps and 3D charts). And
finally we also provide a few chart types that are "native" to Streamlit,
like st.line_chart and st.area_chart.
Previous Streamlit Lottie Integrate Lottie animations inside your Streamlit app. Created by @andfanilo .
lottie_hello = load_lottieurl("https://assets5.lottiefiles.com/packages/lf20_V9t630.json")
st_lottie(lottie_hello, key="hello")
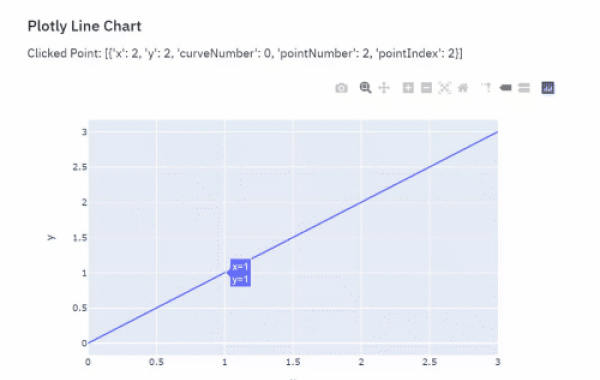
Plotly Events Make Plotly charts interactive!. Created by @null-jones .
fig = px.line(x=[1], y=[1])
selected_points = plotly_events(fig)
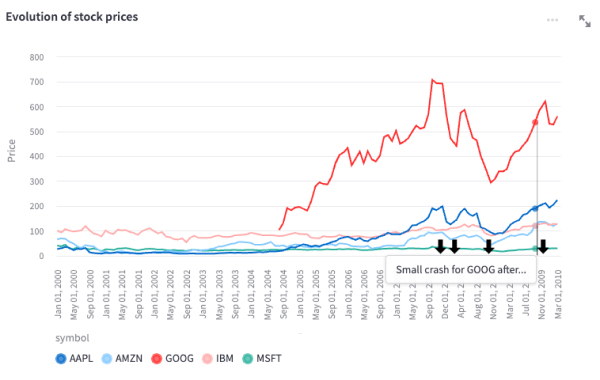
Streamlit Extras A library with useful Streamlit extras. Created by @arnaudmiribel .
chart += get_annotations_chart(annotations=[("Mar 01, 2008", "Pretty good day for GOOG"), ("Dec 01, 2007", "Something's going wrong for GOOG & AAPL"), ("Nov 01, 2008", "Market starts again thanks to..."), ("Dec 01, 2009", "Small crash for GOOG after..."),],)
st.altair_chart(chart, use_container_width=True)
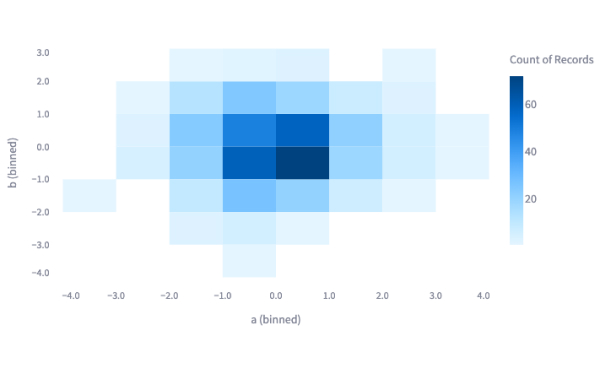
Plost A deceptively simple plotting library for Streamlit. Created by @tvst .
import plost
plost.line_chart(my_dataframe, x='time', y='stock_value', color='stock_name',)
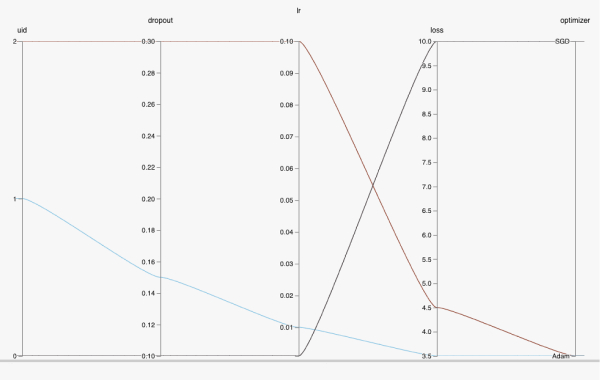
HiPlot High dimensional Interactive Plotting. Created by @facebookresearch .
data = [{'dropout':0.1, 'lr': 0.001, 'loss': 10.0, 'optimizer': 'SGD'}, {'dropout':0.15, 'lr': 0.01, 'loss': 3.5, 'optimizer': 'Adam'}, {'dropout':0.3, 'lr': 0.1, 'loss': 4.5, 'optimizer': 'Adam'}]
hip.Experiment.from_iterable(data).display()
ECharts High dimensional Interactive Plotting. Created by @andfanilo .
from streamlit_echarts import st_echarts
st_echarts(options=options)
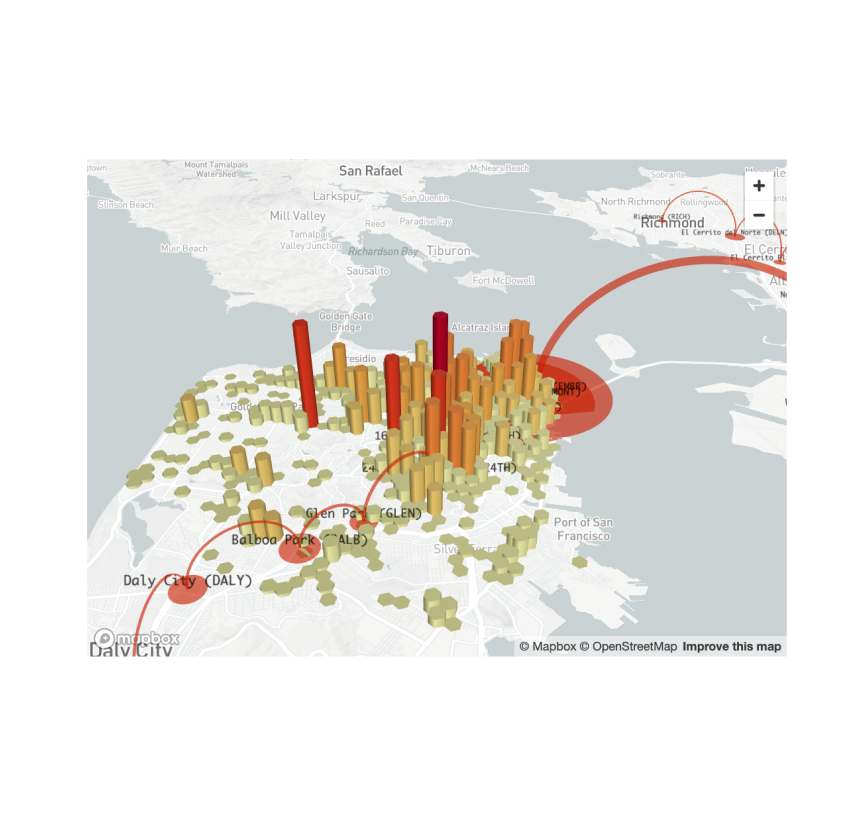
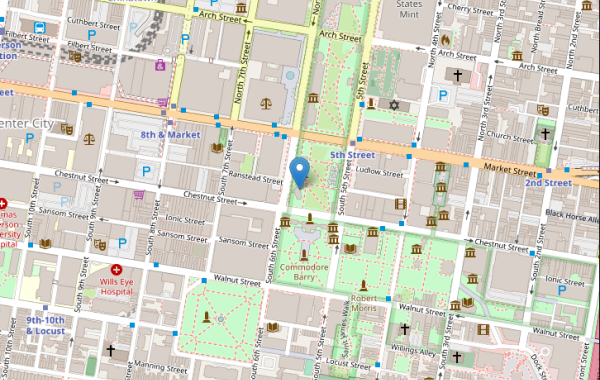
Streamlit Folium Streamlit Component for rendering Folium maps. Created by @randyzwitch .
m = folium.Map(location=[39.949610, -75.150282], zoom_start=16)
st_data = st_folium(m, width=725)
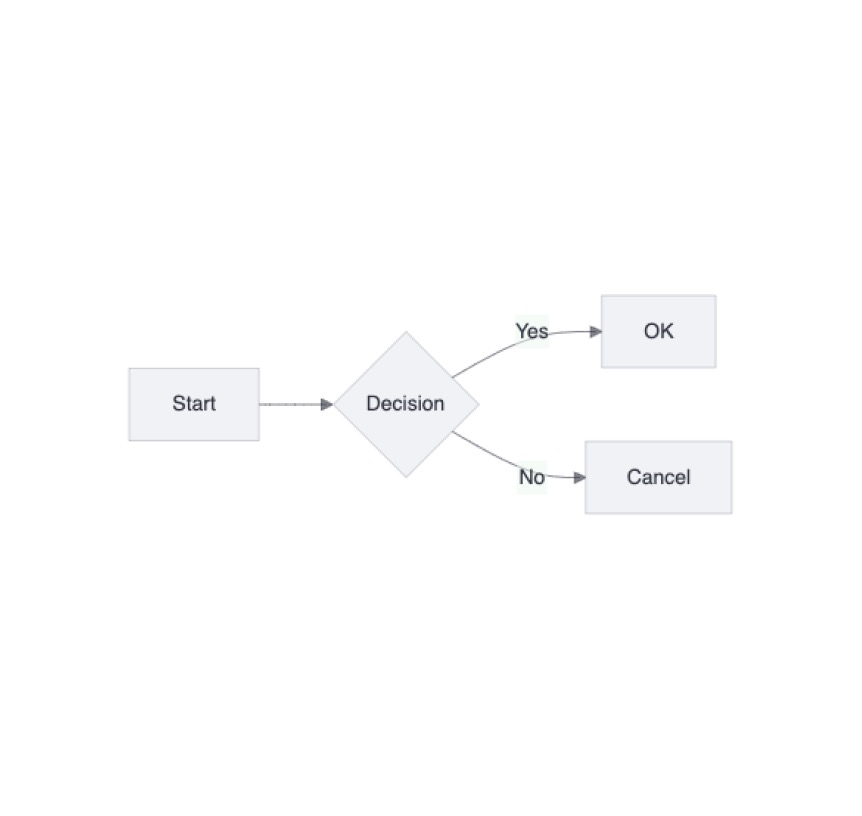
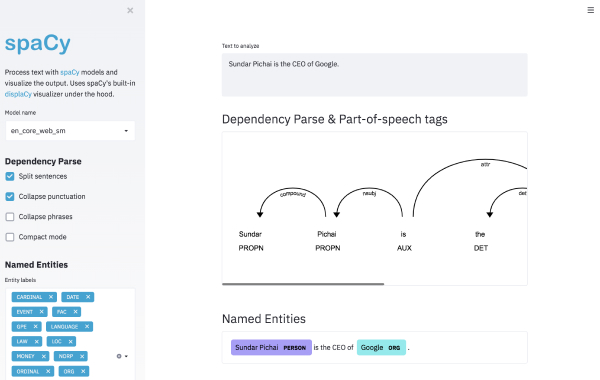
Spacy-Streamlit spaCy building blocks and visualizers for Streamlit apps. Created by @explosion .
models = ["en_core_web_sm", "en_core_web_md"]
spacy_streamlit.visualize(models, "Sundar Pichai is the CEO of Google.")
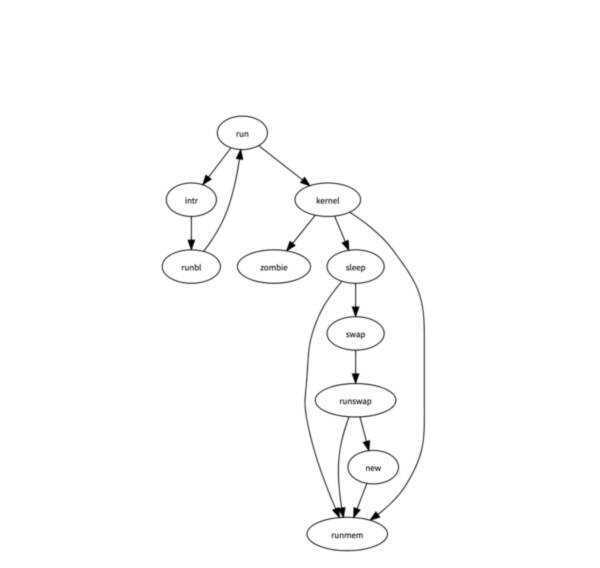
Streamlit Agraph A Streamlit Graph Vis, based on react-grah-vis . Created by @ChrisDelClea .
from streamlit_agraph import agraph, Node, Edge, Config
agraph(nodes=nodes, edges=edges, config=config)
Streamlit Lottie Integrate Lottie animations inside your Streamlit app. Created by @andfanilo .
lottie_hello = load_lottieurl("https://assets5.lottiefiles.com/packages/lf20_V9t630.json")
st_lottie(lottie_hello, key="hello")
Plotly Events Make Plotly charts interactive!. Created by @null-jones .
fig = px.line(x=[1], y=[1])
selected_points = plotly_events(fig)
Streamlit Extras A library with useful Streamlit extras. Created by @arnaudmiribel .
chart += get_annotations_chart(annotations=[("Mar 01, 2008", "Pretty good day for GOOG"), ("Dec 01, 2007", "Something's going wrong for GOOG & AAPL"), ("Nov 01, 2008", "Market starts again thanks to..."), ("Dec 01, 2009", "Small crash for GOOG after..."),],)
st.altair_chart(chart, use_container_width=True)
Plost A deceptively simple plotting library for Streamlit. Created by @tvst .
import plost
plost.line_chart(my_dataframe, x='time', y='stock_value', color='stock_name',)
HiPlot High dimensional Interactive Plotting. Created by @facebookresearch .
data = [{'dropout':0.1, 'lr': 0.001, 'loss': 10.0, 'optimizer': 'SGD'}, {'dropout':0.15, 'lr': 0.01, 'loss': 3.5, 'optimizer': 'Adam'}, {'dropout':0.3, 'lr': 0.1, 'loss': 4.5, 'optimizer': 'Adam'}]
hip.Experiment.from_iterable(data).display()
ECharts High dimensional Interactive Plotting. Created by @andfanilo .
from streamlit_echarts import st_echarts
st_echarts(options=options)
Streamlit Folium Streamlit Component for rendering Folium maps. Created by @randyzwitch .
m = folium.Map(location=[39.949610, -75.150282], zoom_start=16)
st_data = st_folium(m, width=725)
Spacy-Streamlit spaCy building blocks and visualizers for Streamlit apps. Created by @explosion .
models = ["en_core_web_sm", "en_core_web_md"]
spacy_streamlit.visualize(models, "Sundar Pichai is the CEO of Google.")
Streamlit Agraph A Streamlit Graph Vis, based on react-grah-vis . Created by @ChrisDelClea .
from streamlit_agraph import agraph, Node, Edge, Config
agraph(nodes=nodes, edges=edges, config=config)
Streamlit Lottie Integrate Lottie animations inside your Streamlit app. Created by @andfanilo .
lottie_hello = load_lottieurl("https://assets5.lottiefiles.com/packages/lf20_V9t630.json")
st_lottie(lottie_hello, key="hello")
Plotly Events Make Plotly charts interactive!. Created by @null-jones .
fig = px.line(x=[1], y=[1])
selected_points = plotly_events(fig)
Streamlit Extras A library with useful Streamlit extras. Created by @arnaudmiribel .
chart += get_annotations_chart(annotations=[("Mar 01, 2008", "Pretty good day for GOOG"), ("Dec 01, 2007", "Something's going wrong for GOOG & AAPL"), ("Nov 01, 2008", "Market starts again thanks to..."), ("Dec 01, 2009", "Small crash for GOOG after..."),],)
st.altair_chart(chart, use_container_width=True)
Next forum Still have questions? Our forums are full of helpful information and Streamlit experts.