Data elements
When you're working with data, it is extremely valuable to visualize that data quickly, interactively, and from multiple different angles. That's what Streamlit is actually built and optimized for.
You can display data via charts, and you can display it in raw form. These are the Streamlit commands you can use to display and interact with raw data.
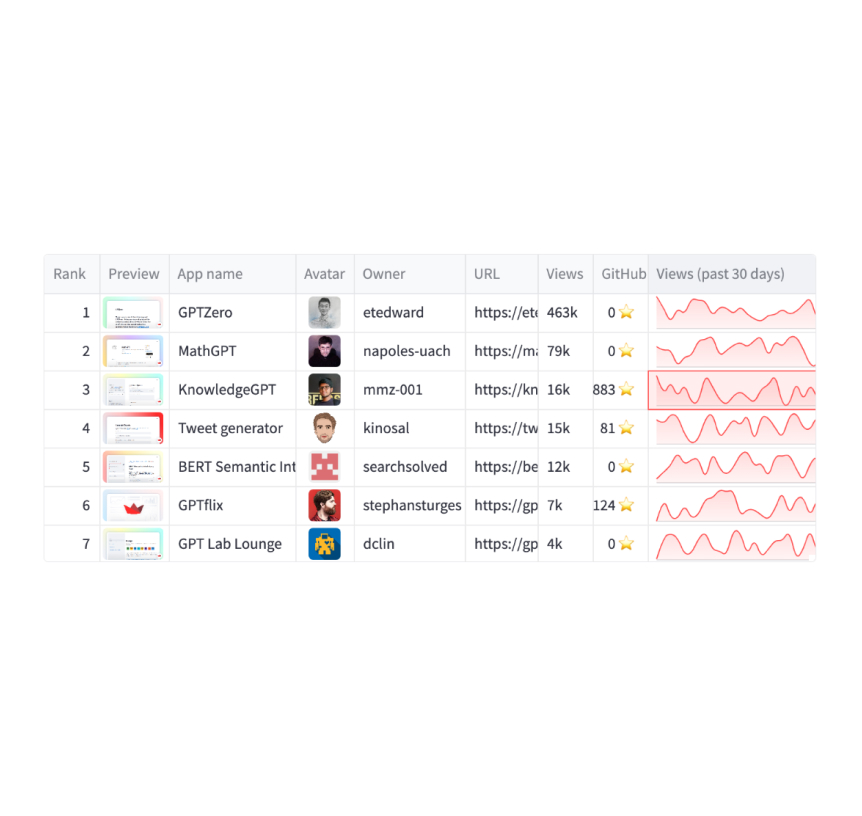
Dataframes
Display a dataframe as an interactive table.
Python
st.dataframe(my_data_frame)
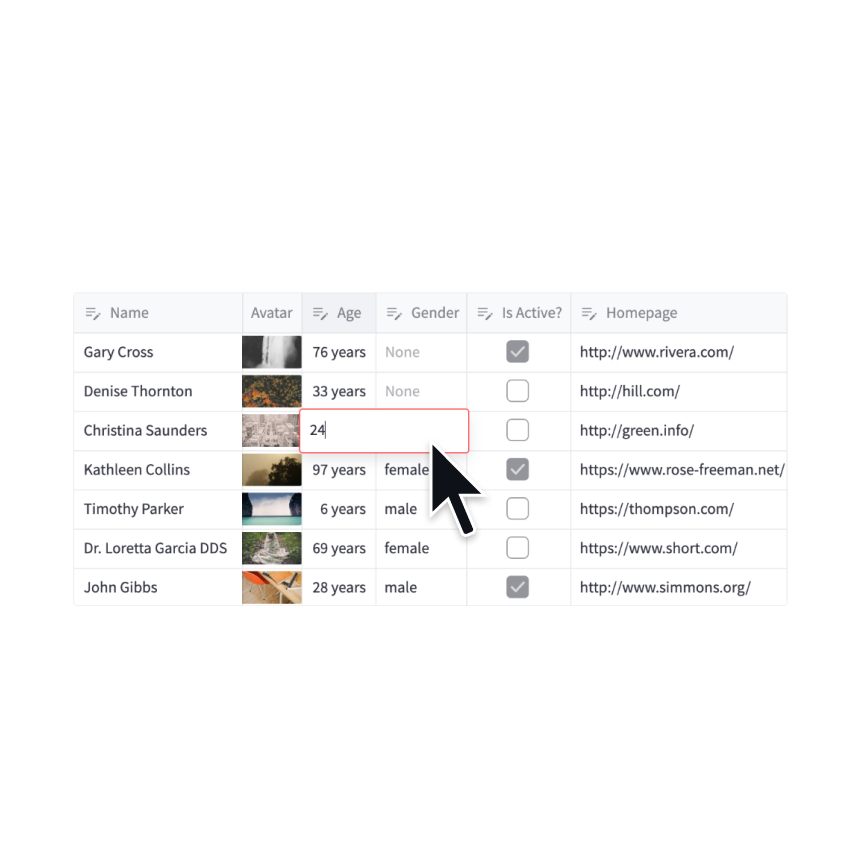
Data editor
Display a data editor widget.
Python
edited = st.data_editor(df, num_rows="dynamic")
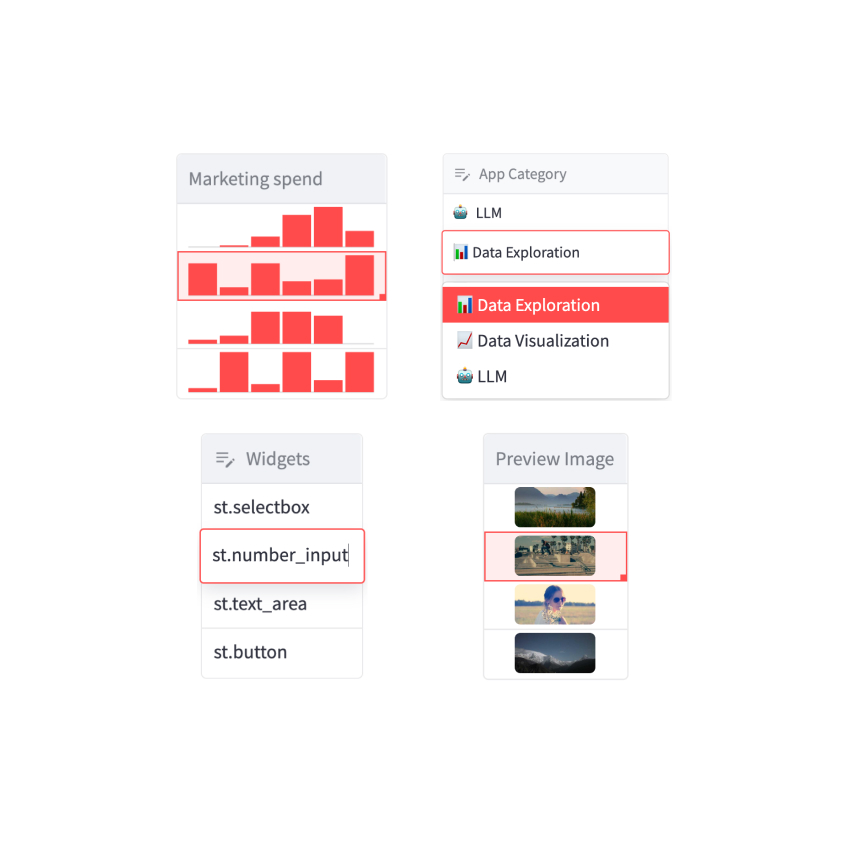
Column configuration
Configure the display and editing behavior of dataframes and data editors.
Python
st.column_config.NumberColumn("Price (in USD)", min_value=0, format="$%d")
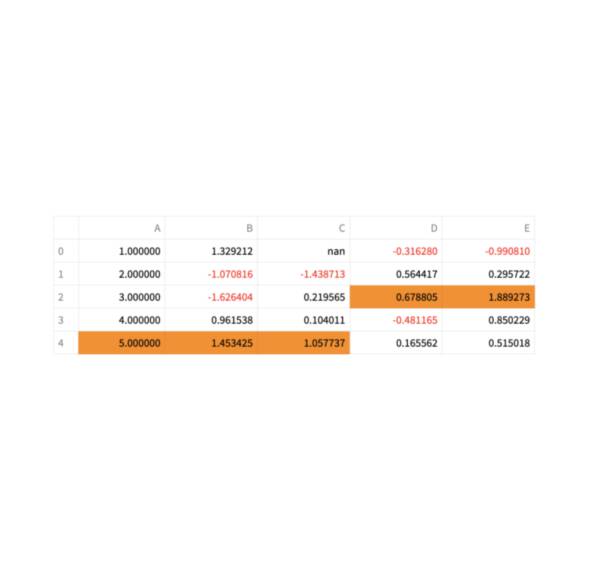
Static tables
Display a static table.
Python
st.table(my_data_frame)
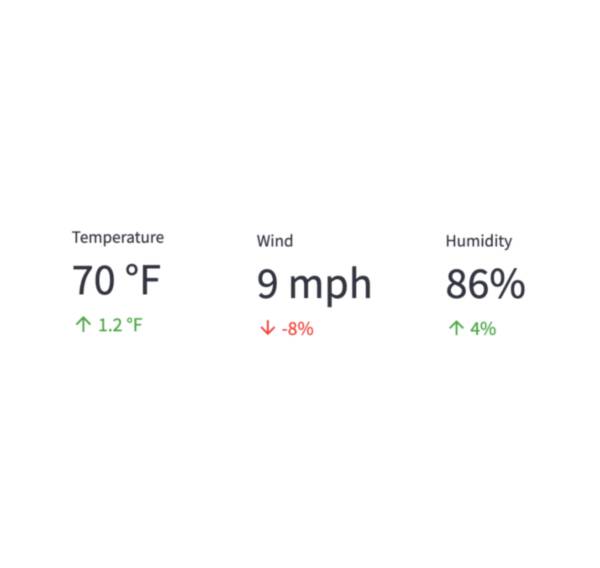
Metrics
Display a metric in big bold font, with an optional indicator of how the metric changed.
Python
st.metric("My metric", 42, 2)
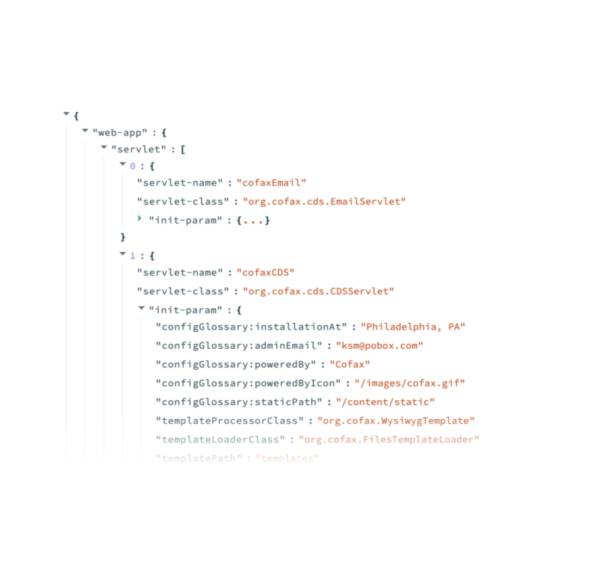
Dicts and JSON
Display object or string as a pretty-printed JSON string.
Python
st.json(my_dict)
Still have questions?
Our forums are full of helpful information and Streamlit experts.