Chart elements
Streamlit supports several charting libraries. The simple chart commands, like
st.line_chart and st.bar_chart, give you a chart from a dataframe in one line.
For more control, use Vega-Lite through
Altair, or Apache ECharts for chart types like
sankey diagrams, gauges, and network graphs. Streamlit also supports Plotly,
Matplotlib, deck.gl maps, and Mermaid and
Graphviz diagrams.
Tip
Not sure which command to use? See Choosing and using charts.
Simple chart elements
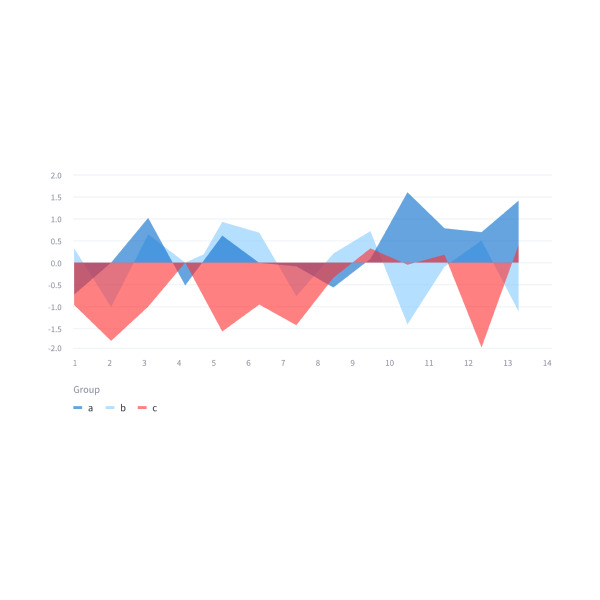
Simple area charts
Display an area chart.
st.area_chart(my_data_frame)
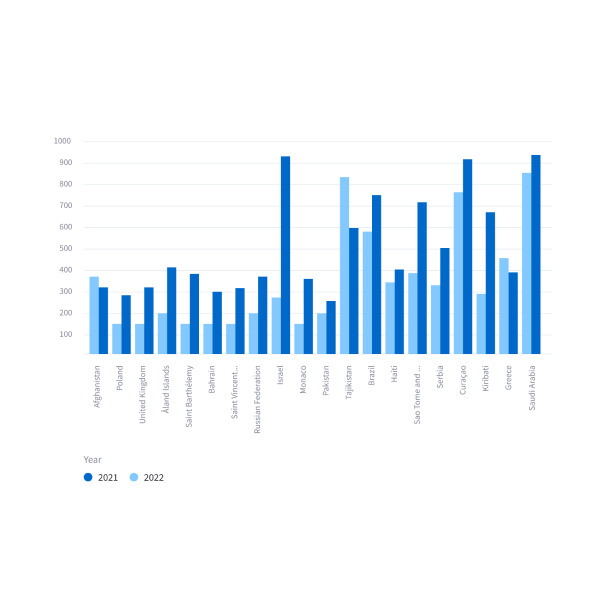
Simple bar charts
Display a bar chart.
st.bar_chart(my_data_frame)
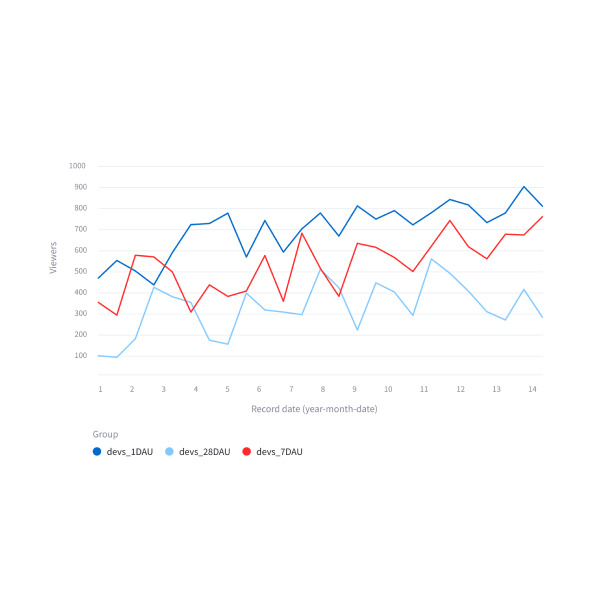
Simple line charts
Display a line chart.
st.line_chart(my_data_frame)

Simple scatter charts
Display a scatter chart.
st.scatter_chart(my_data_frame)
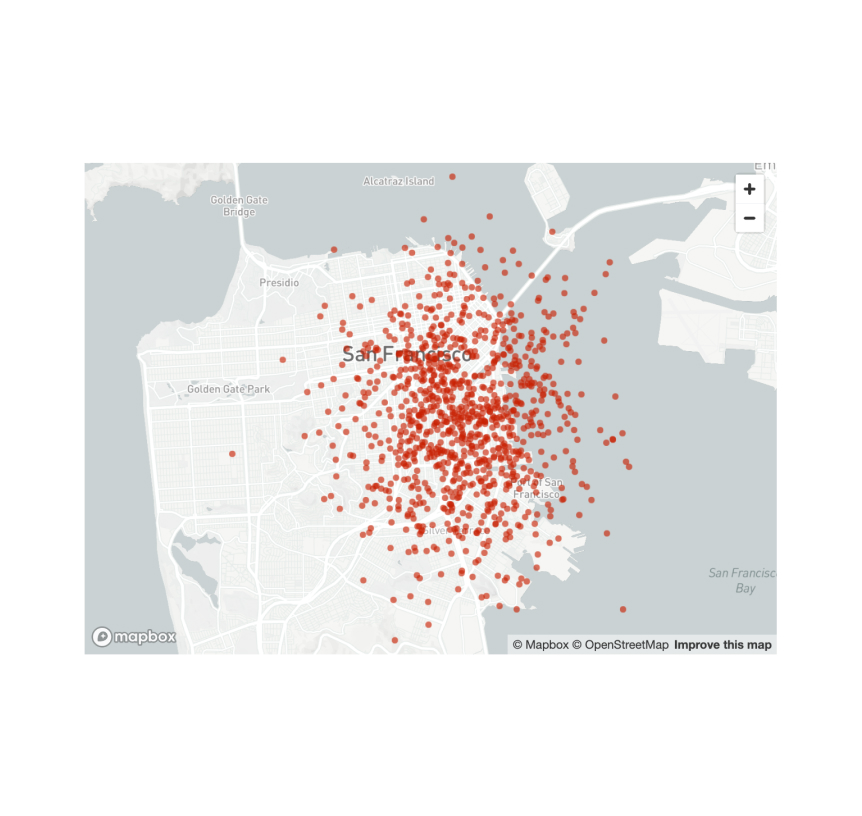
Scatterplots on maps
Display a map with points on it.
st.map(my_data_frame)
Advanced chart elements
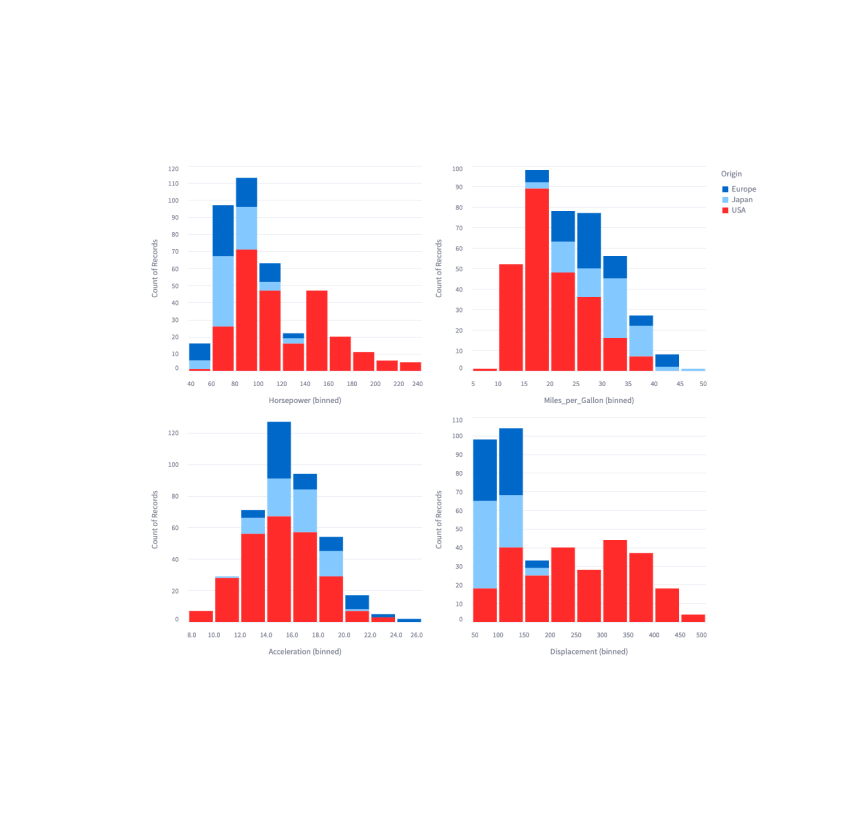
Altair
Display a chart using the Altair library.
st.altair_chart(my_altair_chart)
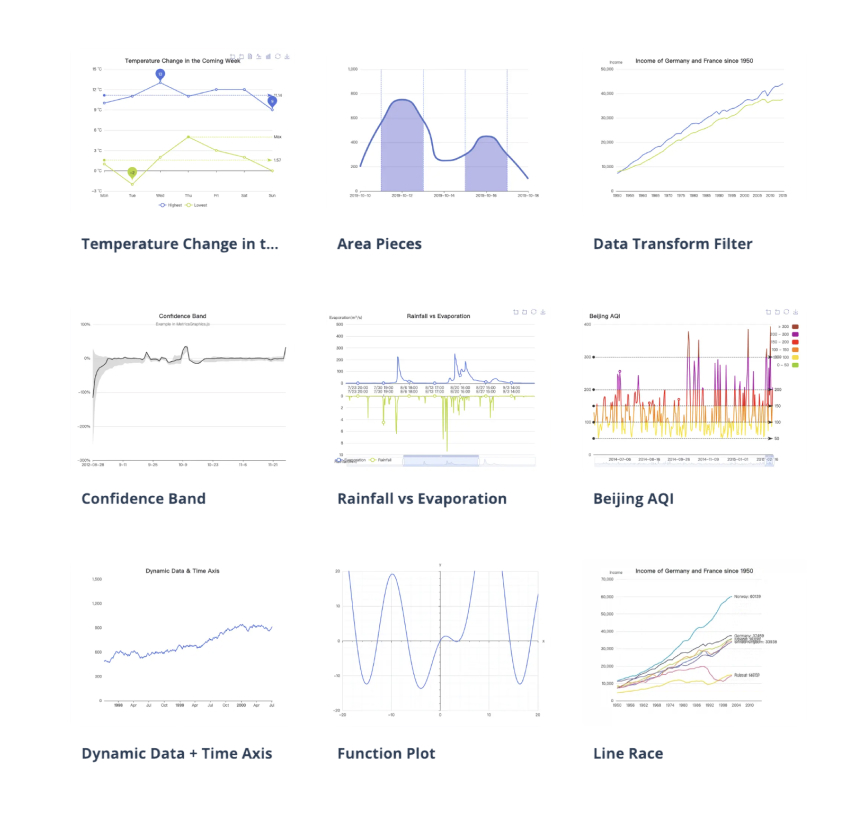
ECharts
Display an interactive Apache ECharts chart, including sankey, gauge, network, and other chart types.
st.echarts_chart(my_echarts_option)
Vega-Lite
Display a chart using the Vega-Lite library.
st.vega_lite_chart(my_vega_lite_chart)
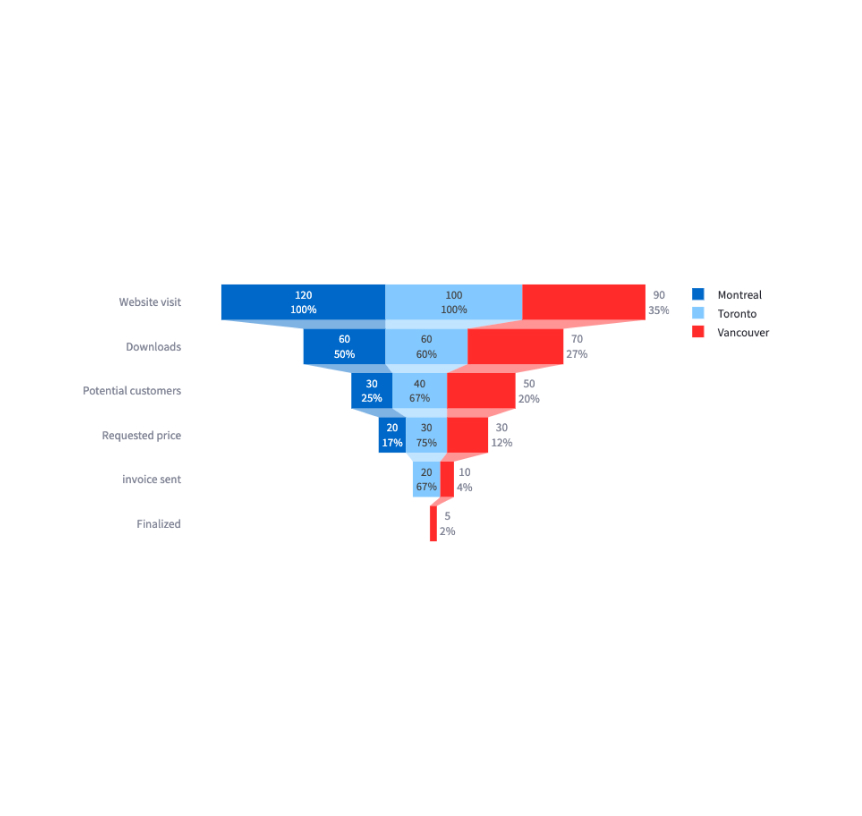
Plotly
Display an interactive Plotly chart.
st.plotly_chart(my_plotly_chart)
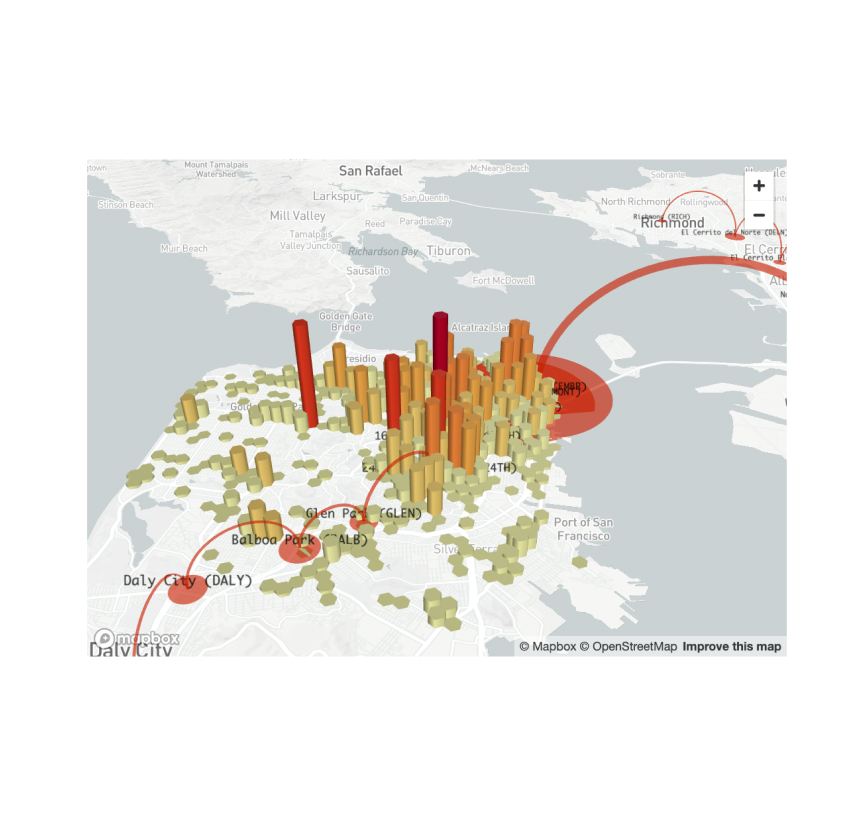
PyDeck
Display a chart using the PyDeck library.
st.pydeck_chart(my_pydeck_chart)
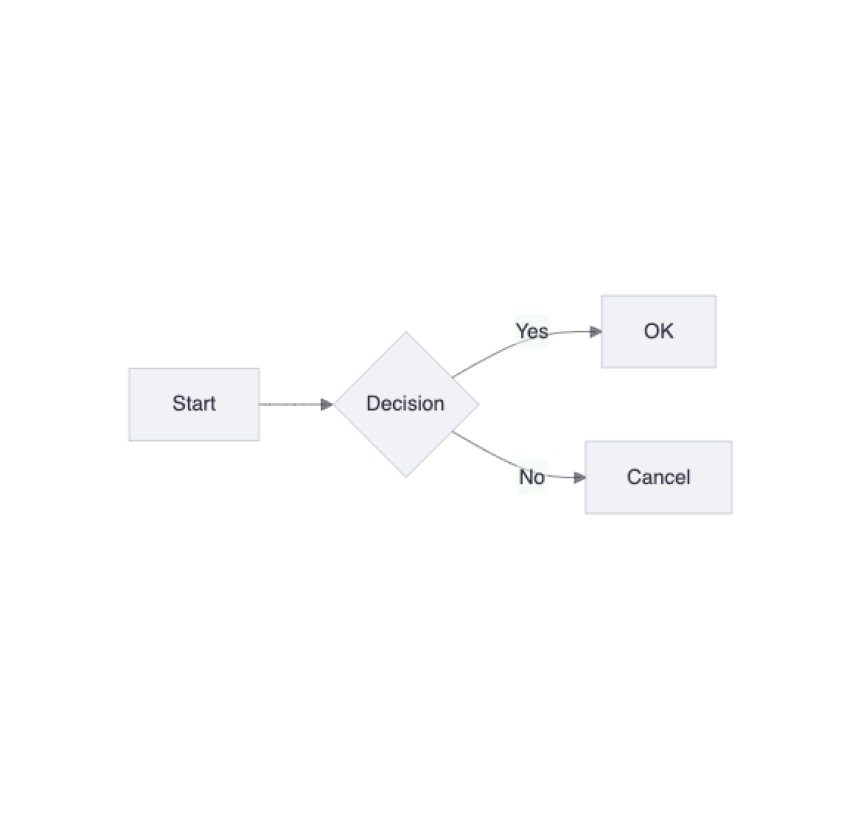
Mermaid chart
Display a Mermaid diagram.
st.mermaid_chart("graph LR\n A --> B")
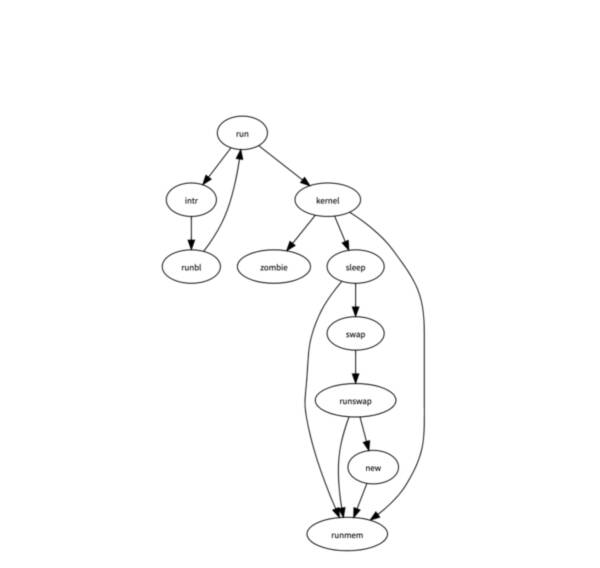
GraphViz
Display a graph using the dagre-d3 library.
st.graphviz_chart(my_graphviz_spec)
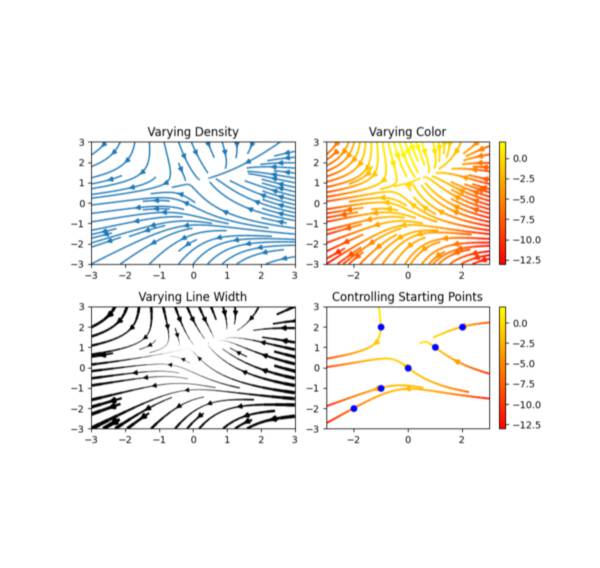
Matplotlib
Display a matplotlib.pyplot figure.
st.pyplot(my_mpl_figure)
Still have questions?
Our forums are full of helpful information and Streamlit experts.